
This conversation is grounded in the U.S. context, with an emphasis on New York City.
We talk a lot about “smart cities,” but the reality of how our streets operate is often surprisingly analog. At the Innovation Summit 2026 hosted by the Center for Smart Streetscapes (CS3), the conversation moved beyond the usual buzzwords to a more critical tension: the gap between the technology we have (AI, sensors, real-time data) and the bureaucracy we’ve inherited in the U.S. political system.
The consensus? We are too risk-averse. The reality is that many public servants do not have the quantitative training needed to internalize the results created by various machine learning models; many transportation/ML researchers may lack an understanding of local regulatory, financial, operational, and infrastructural realities.
Becoming less risk-averse towards public interest technologies requires multiple levers to be pulled and multiple stakeholders to speak a shared language, with a lucid understanding of what is at stake, what the transition can do for our cities, what synergies and interdependencies exist, and what obstacles we need to overcome in a semi-predictable, realistic timeline.
Here are the key takeaways from the summit, featuring insights from Google Public Sector, NYC leadership, and CS3 researchers.
Data Collection And Citywide Traffic Flows
Mehmet Turkcan, an Associate Research Scientist at CS3, focuses on deep learning, the limits of AI, and building systems that can be deployed in practice. In his presentation, he shared results from the INRIX+ MetroLab Challenge, a project that combines large-scale computer vision with physics-constrained graph neural networks to model and calibrate traffic across New York City.
How the model was constructed and calibrated:
The project grew out of the research group’s work deploying computer vision models at scale for real-time situational awareness. Advances in modern GPUs now make it feasible to process footage from hundreds of traffic cameras simultaneously. Using this capability, the team built a system that analyzes real-time vehicle counts from a network of roughly 900 traffic cameras distributed across all five boroughs of New York City.
The announcement of NYC congestion pricing provided a concrete policy intervention to study. Data collection began on the day congestion pricing was announced in November 2024, enabling a year-over-year comparison of traffic patterns. The analysis focuses on vehicle counts aggregated by time of week, with particular attention to peak periods when congestion is most visible to road users.
To do this, raw vehicle counts from each camera are first smoothed using a rolling average. This step reduces short-term noise caused by incidents, weather, or sensor variability, allowing underlying daily and weekly traffic rhythms to emerge. Traffic observations are then grouped by hour of day, weekday versus weekend, and pre- versus post-intervention period. This ensures that weekday commuting patterns are compared with weekday commuting patterns, rather than being mixed with weekend travel.
The core analytical metric introduced in the project is the Peak Hour Differential, which measures how peak traffic levels shift after an intervention relative to before. Instead of assuming that congestion always occurs at the same clock time, the method identifies the highest average traffic level within broader time windows such as the morning rush, midday, or afternoon peak. This matters because congestion pricing often shifts when peaks occur rather than simply reducing total volume. A peak that moves from 8:00 to 9:00 still stresses the system, even if fixed-time analysis would miss it.


To complement camera data, INRIX supplied traffic volume estimates by road segment and time of day, along with trip-level data derived from GPS sources. However, GPS-based traffic data captures only a fraction of total vehicle movements. This limitation is especially pronounced in dense urban environments like Manhattan, where side street traffic volumes are low and sampling rates can be uneven.
Camera observations, while highly accurate, are spatially sparse. The central methodological idea is to use these camera-based counts as ground truth to calibrate a citywide traffic model. By treating the city as a physical network system, sparse camera observations can be used to reconstruct traffic volumes in locations where no cameras are present.
New York City is modeled as a network through which vehicles flow, allowing the researchers to estimate how congestion forms, propagates, and dissipates over time. These dynamics reveal the city’s recurring “heartbeats,” namely the morning and evening rush periods. The model is calibrated using an ensemble Kalman filter that continuously fuse sparse camera counts with broader GPS observations, correcting the model in real time.
Results from Harlem and Morningside Heights demonstrate that even with a limited subset of cameras used for calibration, the model can accurately reconstruct traffic volumes across surrounding areas. This capability enables improved situational awareness and more intelligent routing strategies, with practical implications such as mitigating hours-long traffic jams in Lower Manhattan caused by inefficient side-street routing.
For readers interested in exploring the interactive results and visualizations, the project site is available at: https://mkturkcan.github.io/congestionpricing/.
This project stands as proof that across government data platforms, research labs and tech companies, we have possessed the tools for real time computer vision, large scale GPS traces, and AI models capable of reconstructing citywide traffic flows. However, these models remain stuck in pilots, proofs of concept, or one-off deployments.
So how, and at what point, can we confidently implement these models into operational decision-making?
Funding Risk And Eisenhower Era Innovation
Kristin White (Google Public Sector) said that one of the recent innovations in U.S. transportation was from the Eisenhower era (1953–1961).
We often view the Interstate Highway System as an inevitability, but it was a massive gamble. President Dwight D. Eisenhower didn’t just wake up and pave America; he was driven by a 1919 military convoy trip across the U.S. that took 62 days and his observations of the German Autobahn during WWII. He understood that national defense and economic growth required a radical new system.
The Federal-Aid Highway Act of 1956 was innovative not just in concrete, but in finance. It established the Highway Trust Fund, backed by federal fuel taxes, to cover 90% of the $25 billion cost.
White argued that today’s government procurement is too slow to match that scale of innovation. We are paralyzed by the fear of failure. We need a “High-Lift” idea for the 21st century: a federal shift that allows us to procure outcomes rather than just buying sensors.
Fireside Chat: Why Public Innovation Feels “Stuck”; Procurement, paralysis, and “thinking different”
[Edited from transcript]
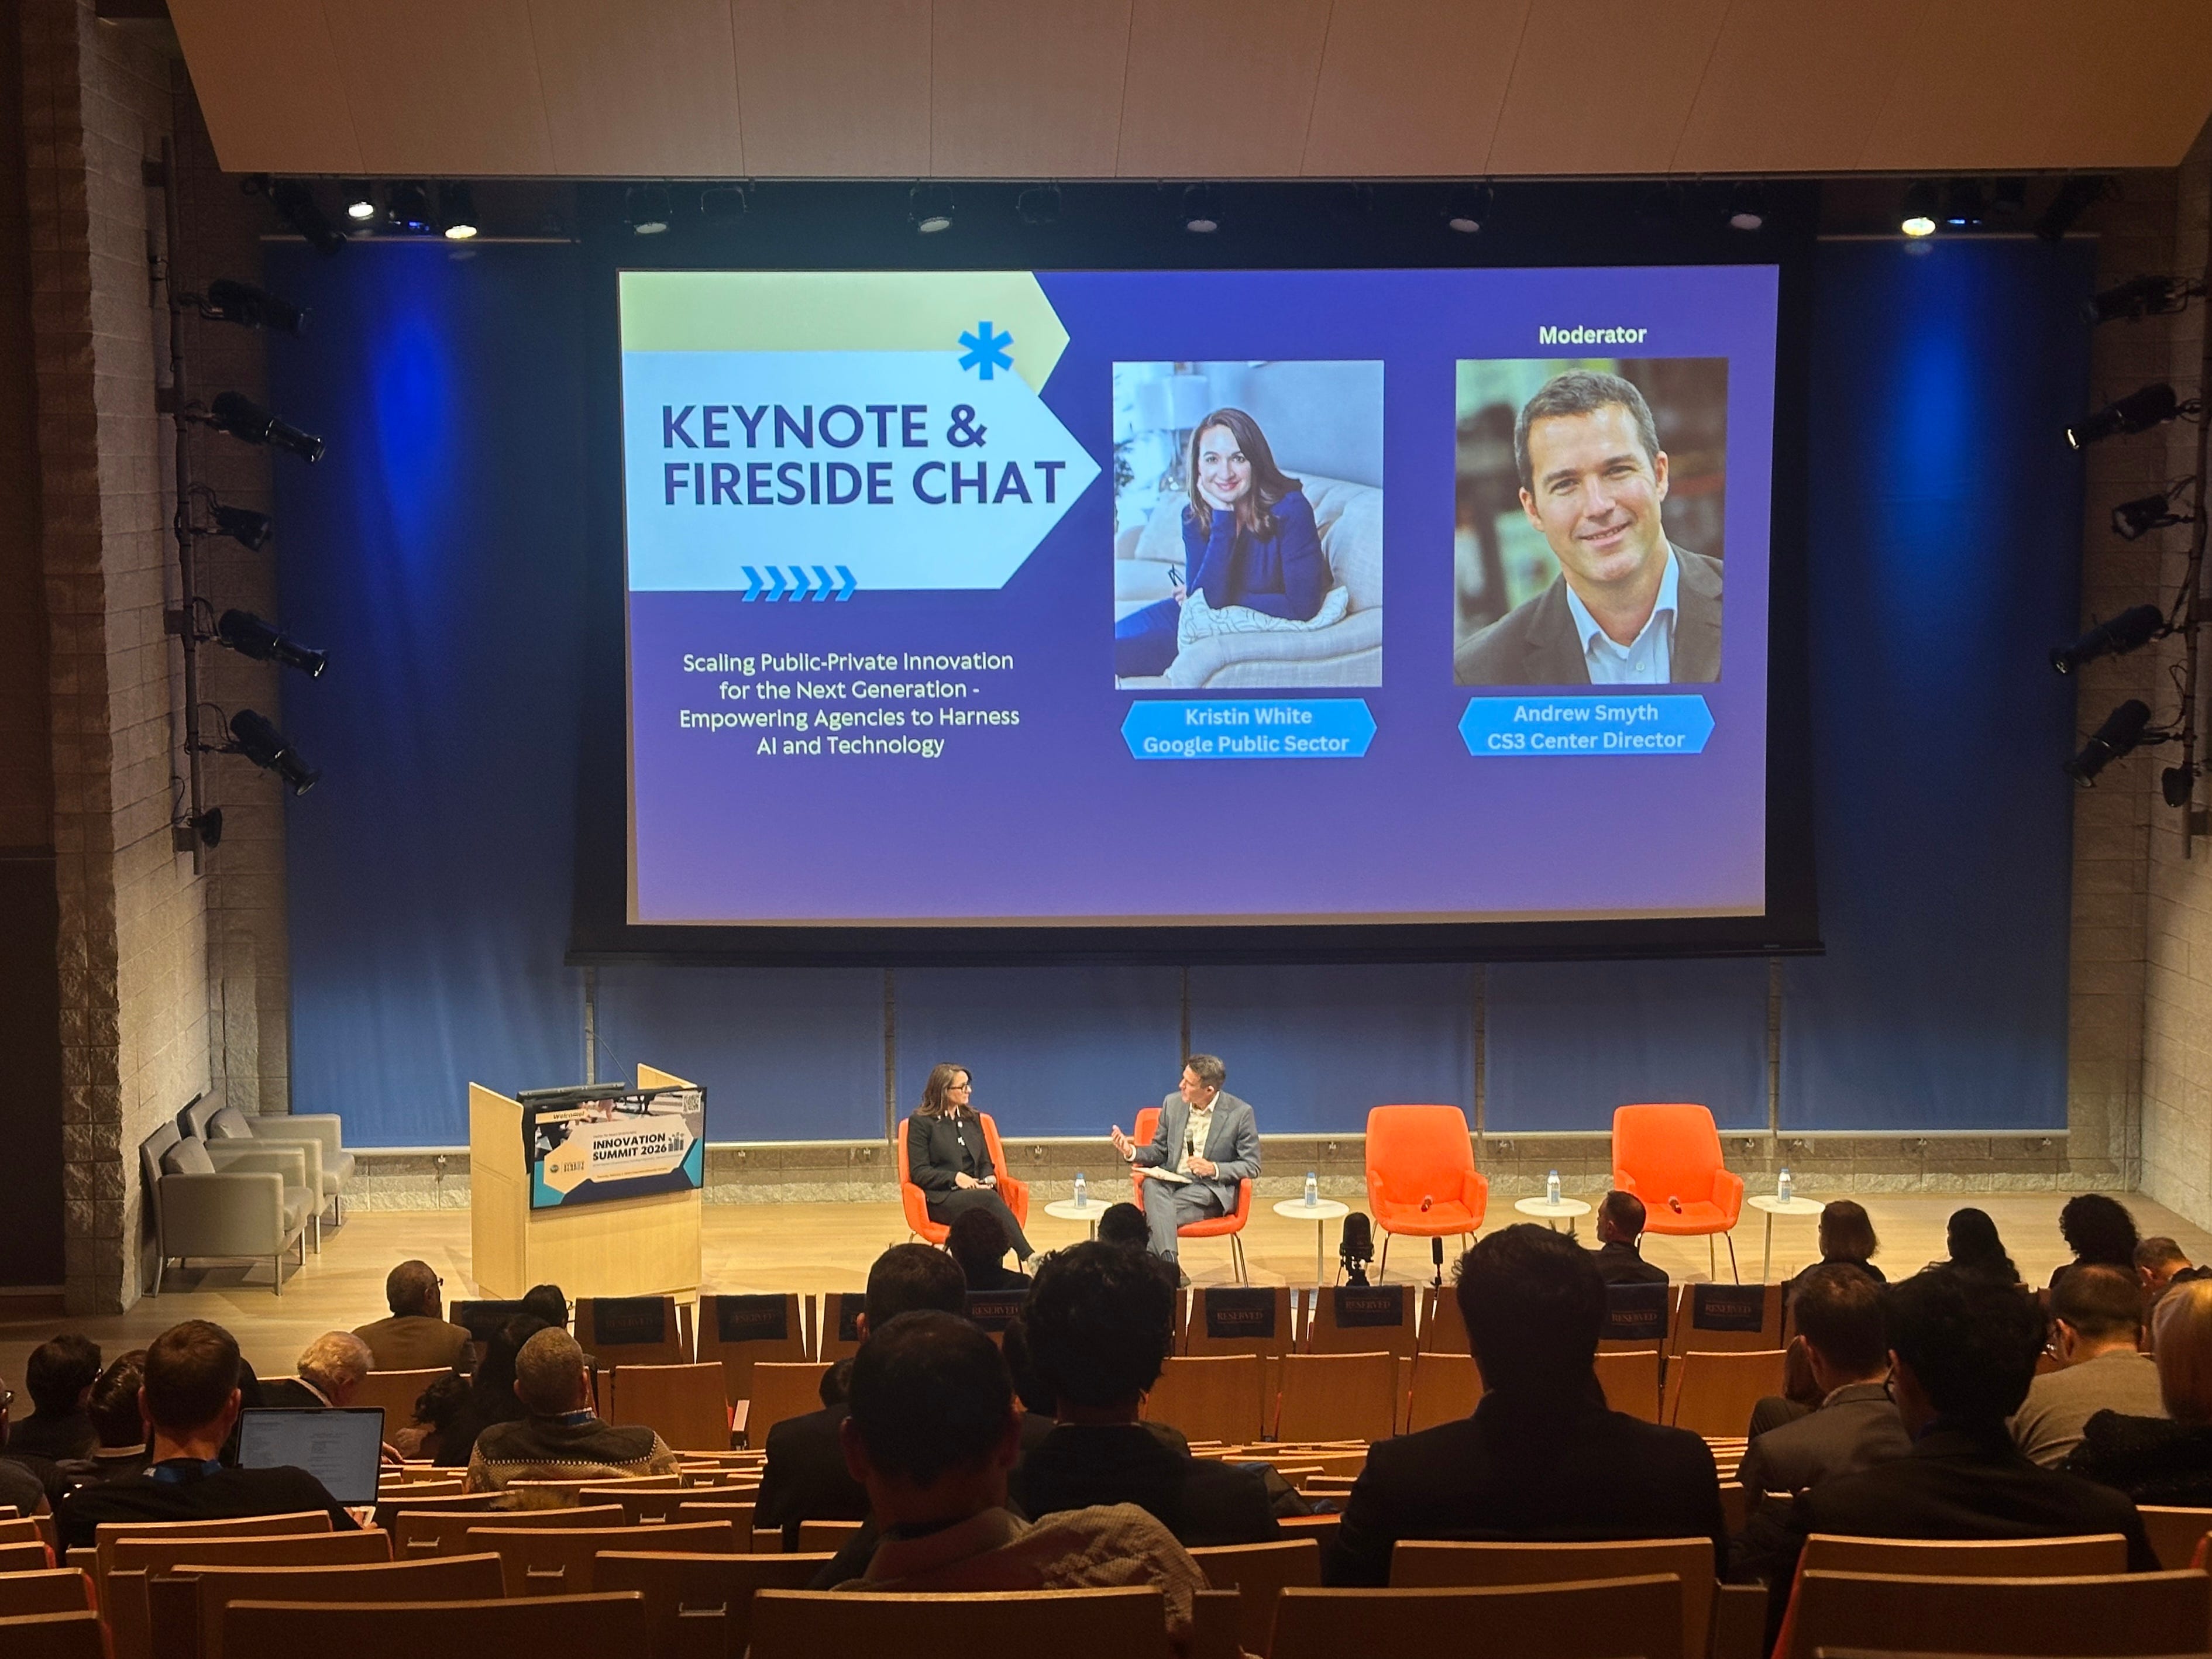
Moderator: You mentioned shifting procurement methodologies to be more outcomes focused. Prioritize pilots and use cases, and then evaluate them with strong outcomes-based methods. I’ve worked with public agencies and I hear the same thing a lot: they feel paralyzed by the law. They don’t want to own a system that’s obsolete the moment they buy it. From the industry side, are there procurement models that actually unlock innovation?
Kristin White (Google Public Sector): Yeah. First, I feel that. I came out of a legal background and the fear is real because the accountability is real. But there are models that work, and we should normalize them nationally.
One is shared procurements. If an agency is blocked by its lawyers or local constraints, it can sometimes participate through another jurisdiction’s procurement instead of starting from scratch. That should be a national model, especially for emerging tech where no one wants to be the first mover alone.
Second is NASPO, the National Association of State Procurement Officials. We worked with them about a decade ago when our program started. We built what we call an open, rolling, outcomes-based solicitation. Instead of a locked specification that assumes the solution, we publish problem statements. Industry can propose solutions that meet clear outcomes. If you think you can deliver and sell something that hits those outcomes, we will pay you to do that. NASPO has really evangelized this approach.
And I’ll add something that doesn’t get said enough: research institutions should help build the templates. Better specifications, better procurement language, better evaluation plans. I know it’s not the sexiest research topic. I can’t imagine every grad student dreaming of “procurement templates.” But honestly, it might be one of the biggest catalysts for public-interest technology. If you want to work on that, I will be your mentor. We need it.
Moderator: Two quick questions then. One: business models, what’s in it for the public sector and how do they finance this infrastructure? Two: we have a lot of researchers and students here, what non-technical advice do you think they underestimate?
Kristin White: I want to start with the second one because I’ve been thinking about it a lot. This is why I love a fireside chat. It’s not canned.
I moved from Washington, D.C. to Silicon Valley, and what I realized is that environment changes you. In Silicon Valley people are brainstorming constantly. Whiteboards, Post-its, ideation all the time. And I think we fail to do that in transportation and government. We don’t actually take time to think different.
A friend at the Transportation Research Board annual meeting reminded me: “Kristin, the last time we truly innovated transportation nationally was when Eisenhower funded the interstate system.” Since then, we’ve made incremental changes, but we haven’t transformed the system at a national level. Maybe part of that is because we’re not thinking different.
So here’s a practical idea. I’m trying to get my team out of our element. I’m taking a week in March to do a deep dive at Stanford’s design thinking school, just to learn how other industries build new ideas. And there’s also a concept I learned early in my career from 3M, my first client as a lawyer, because they do road signs and pavement markings. At 3M they have “10% time.” You’re encouraged to spend about ten percent of your time doing something completely different. Attend a conference. Take a class. Go for a walk. Go skydiving. Do something that breaks your routines because that’s how new ideas show up.
And one more thing for students: if you want your work to be legible and adopted, cut the jargon. Speak plainly. Make it understandable to the people who have to defend it in public.
Audience member: I just bought a new car, a Genesis GV70, and the technology is new. But my Google Maps on my phone navigates better than the built-in navigation on the car. Same streets. Same area. Locally, I also have a gut feel: tourism is crazy right now, so I avoid certain roads to get to the airport. Why are two devices in the same place giving me different quality routes?
Kristin White: First, thank you for being here. You’re literally doing the 10% time idea by flying up just for this.
On your question: you’ve noticed something real. For years, the transportation world and the automotive world have innovated in parallel and not always together. There are transportation conferences and associations talking about infrastructure tech, and separate automotive events talking about vehicle tech, and they’re not always speaking the same language or sharing the same feedback loops. We’re getting better at bridging that gap, especially in the last few years, but it’s still a work in progress. We need more cross-industry collaboration so the systems in your car and the systems on your phone aren’t living in separate universes.
Audience member: If I drive from New York to California, can Google tell me everything about my trip?
Kristin White: It all comes down to privacy. Google has a lot of information, but we have to balance information with privacy protection. People opt in to share data through products like Waze, Android Auto, and Maps. But we have a fundamental privacy challenge, especially in rural America. On roads with very few drivers, if you showed high-resolution movement data, someone could identify a specific person. That’s why you sometimes see less coverage in rural areas. Privacy isn’t a footnote, it shapes what’s possible.
And honestly, bridging that values conversation, information, safety, privacy, is a place where academia can help us. We haven’t solved it yet, but we’re working on it.
From Sensors to Systems: What Real-Time Traffic Data Could Actually Change
Highlights from the panel “From Sensors to Systems: Real-Time Traffic Analysis for Faster Decision Making”
The panel on operational decision-making, featuring Robert Holbrook (City of New York), Ahmed Darrat (INRIX), and Mehmet Turkcan (CS3), drilled down into why deploying AI on the street is so hard.
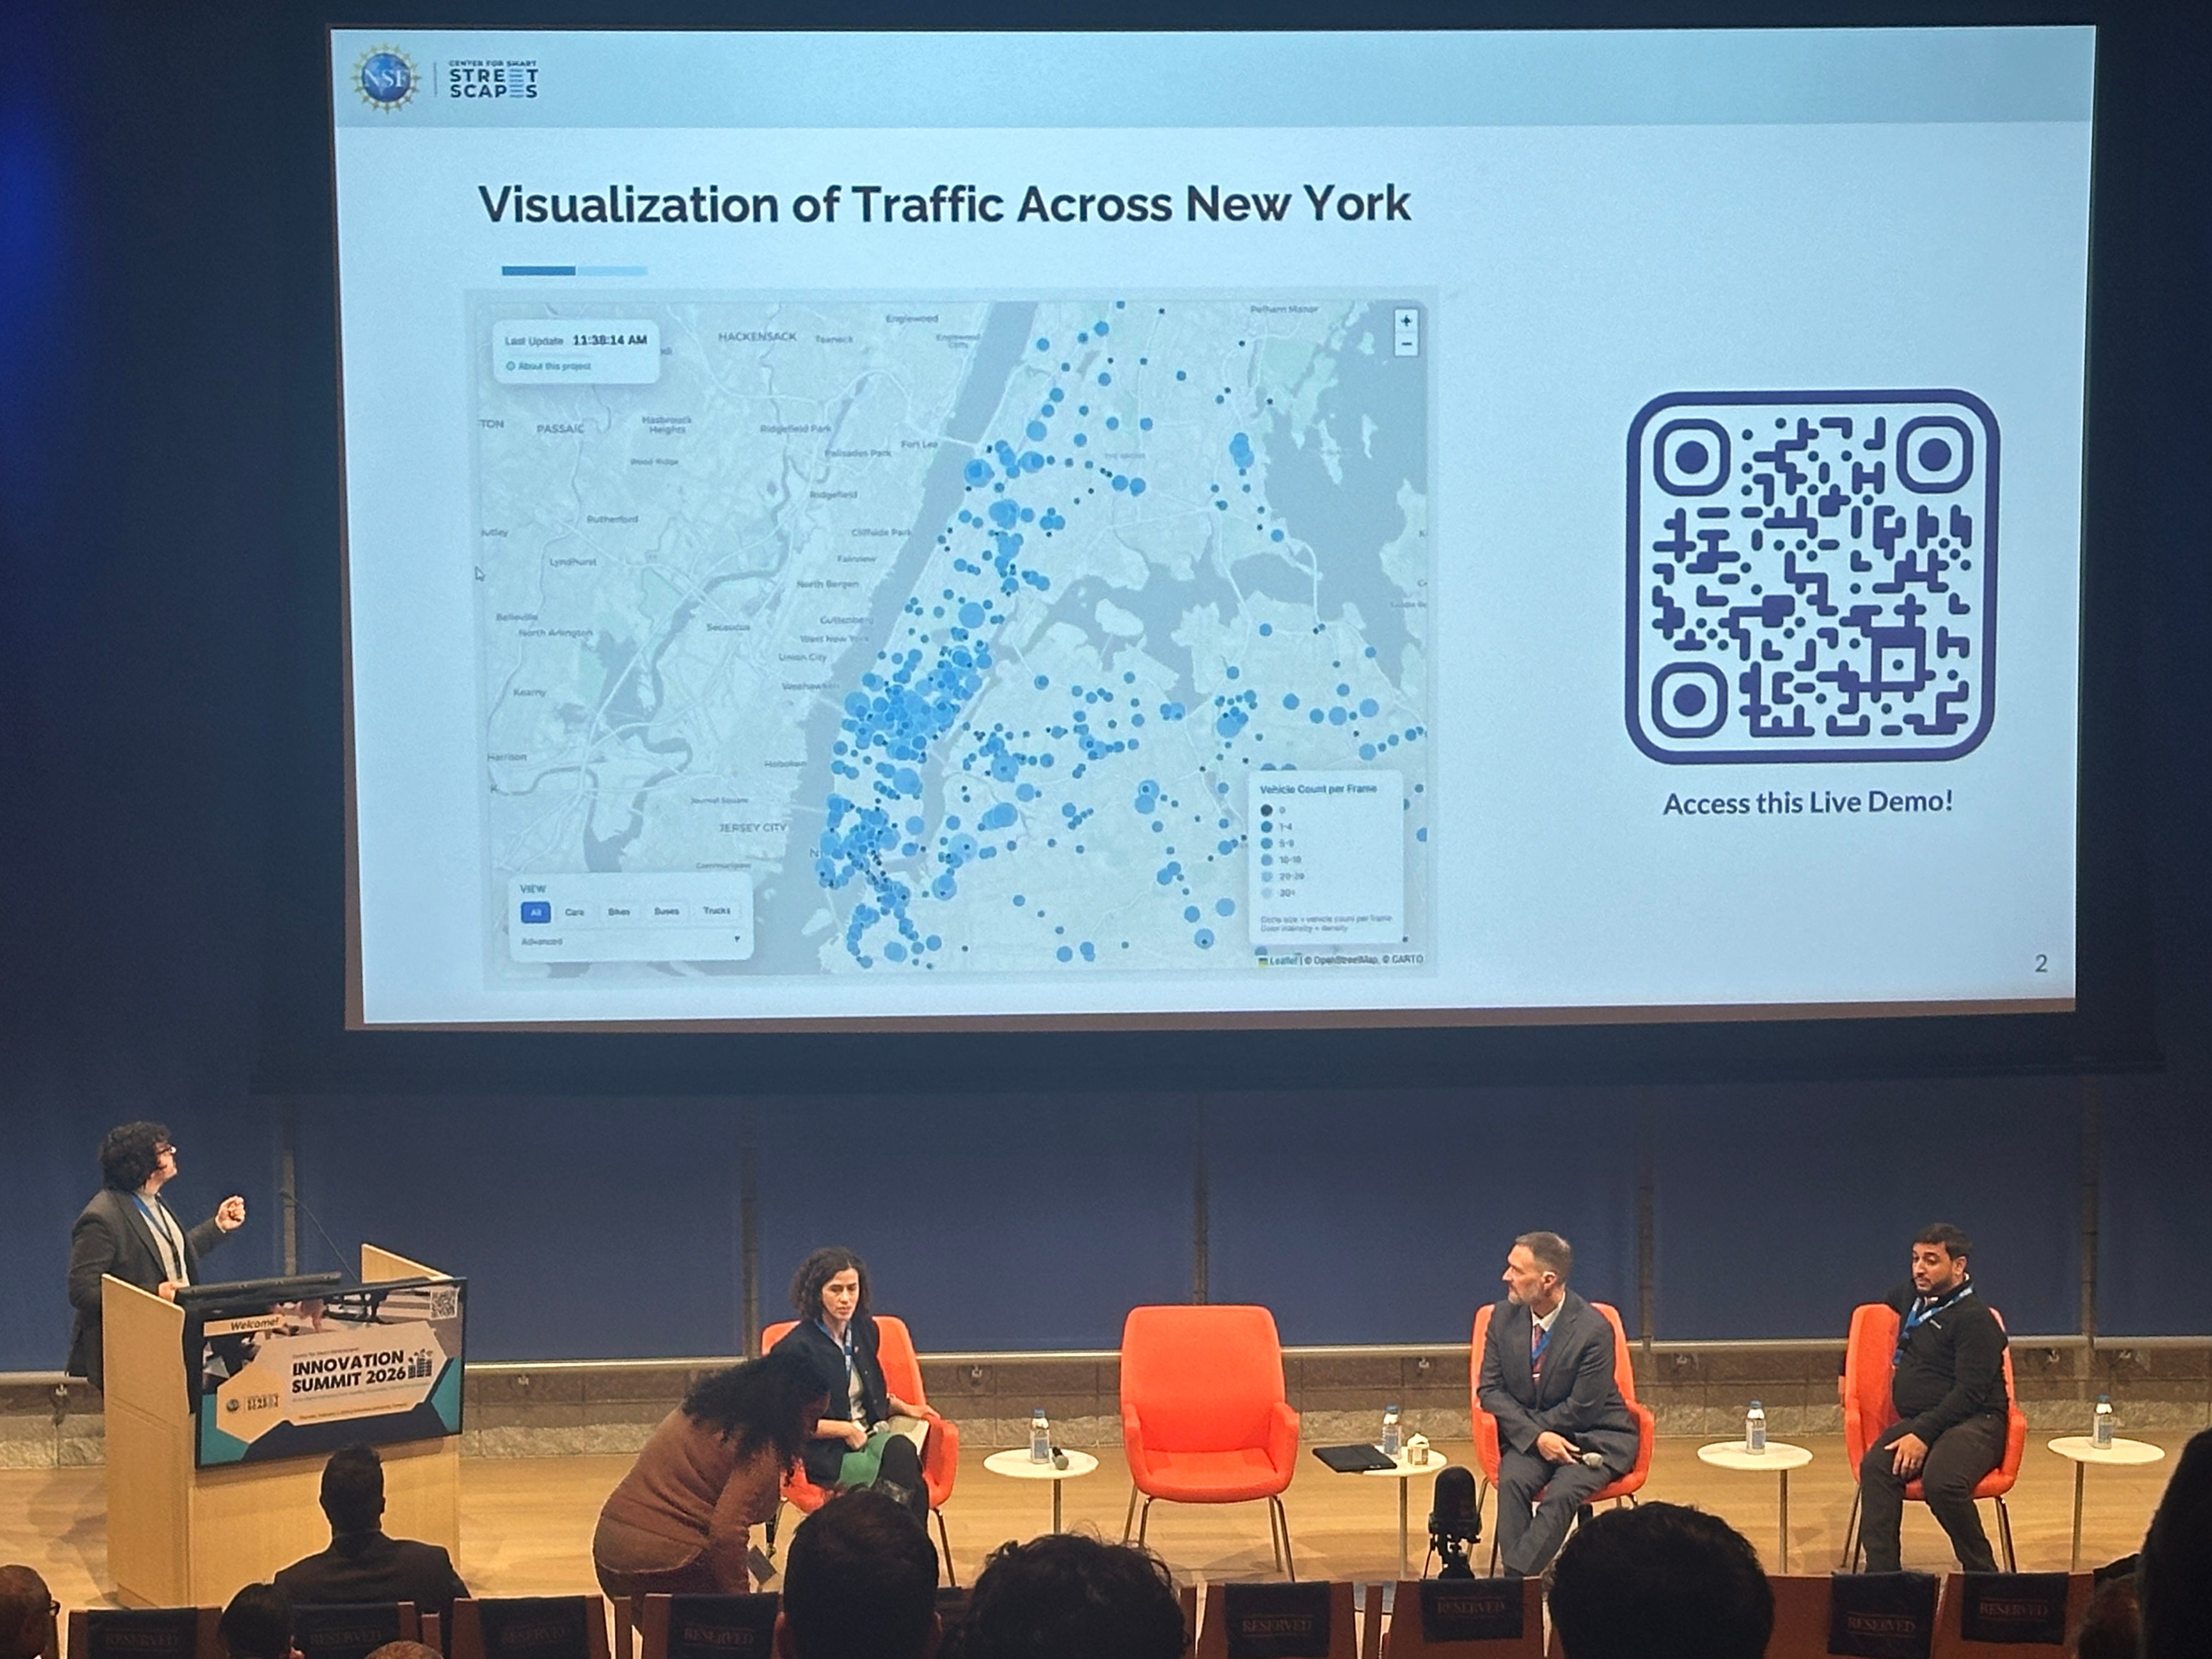
If the fireside chat asked why public innovation feels stuck, the second panel got into the weeds of how it might finally move.
Below are the key takeaways.
1. The “9:30 AM” Problem
Ahmed Darrat illustrated the rigidity of current systems with a simple example. In NYC, traffic signal plans often switch from “Morning” to “Midday” at exactly 9:30 AM.
Most large U.S. cities operate traffic signals using fixed-time plans:
Morning plan
Midday plan
Evening plan
Overnight plan
The problem is that real life does not respect schedules. A crash, construction, or weather event can stretch the morning peak by 30 minutes. When signals switch to a midday plan too early, congestion cascades and can ruin the entire day.
Outfitting every intersection with sensors is not realistic.
New York has roughly 12,000 signalized intersections.
If each sensor costs $7,000 to $10,000, full coverage would cost billions.
Even worse, many traditional sensors are outdated. The panel was clear: deploying old hardware everywhere is not a future-proof solution.
2. The Semantic Shift
Robert Holbrook introduced a powerful reframe for public servants. In an era of polarization, asking the public to “trust” the government is a losing battle.
“What people experience as traffic data on their phone is not what government uses or needs…I prefer to use the word ‘confidence’. We have to have a level of confidence when we speak to stakeholders who might disagree.”
Real-time traffic models are not about navigation. For City of New York, traffic models underpin life-and-death decisions:
Where to place bike lanes and bus lanes
How to daylight intersections for pedestrian safety
How to evaluate housing projects under environmental review
How to meet federal air-quality standards in a non-attainment region
Traffic projections shape housing approvals, emissions modeling, and public safety. That makes them political, contested, and legally exposed.
“Close enough” is not good enough. We need “regulatory grade” data— validation levels high enough to survive a town hall meeting or a court challenge.
3. The Privacy Paradox
A major friction point raised by the researchers is the conflict between validation and privacy.
The Academic Problem: Researchers can’t publish with high-resolution “ground truth” data (faces, license plates) data in top journals.
The City Problem: Cities cannot legally or ethically share high-resolution camera feeds. Why?
Readable license plates create real safety risks
One misuse in a domestic violence case would be unacceptable
The potential Fix: Edge processing. By attaching sensors to network devices that process images locally (on the pole) and only send back the metadata (counts, classifications, flow), we protect privacy. But this creates a new challenge: How do you prove the model is accurate if you can’t see the original images to audit them?
“If we can’t see the video, we need near-99% confidence in the model.”
Building confidence in these “blind” models is the next frontier of certification.
4. Sparse Truth & Citywide Models
The research presented by CS3 showed what becomes possible when high-confidence local data is used to calibrate citywide models.
To summarize the key ingredients:
~900 existing NYC cameras producing real-time vehicle counts
GPS-based traffic data from INRIX, which provides continuous but partial coverage
Physics-constrained graph neural networks modeling NYC as a flow system
Ensemble Kalman filtering to fuse sparse ground truth with network dynamics
Even with as few as ~10 cameras in Harlem and Morningside Heights, the calibrated model could reconstruct traffic volumes across surrounding areas with meaningful accuracy.
“This lets us see the true state of traffic even where we don’t have cameras.”
One concrete outcome: avoiding hours-long gridlock in Lower Manhattan caused by navigation apps routing everyone onto the same side streets.
5. Cameras vs. GPS Is the Wrong Debate
A recurring theme was that no single data source is sufficient.
Cameras provide very high confidence, but only where they exist
GPS data covers everywhere, all the time, but only a fraction of vehicles
Manual counts and pneumatic tubes have major limitations
The real question is data fusion: how to combine sources in a way that produces defensible estimates.
“It’s an apples-to-oranges comparison unless you fuse them.”
This is where academic statistical work becomes critical: interpolating flows between validation points as vehicles turn into driveways, loading zones, or fast-food entrances.
6. The Freight Bike Problem (and Why Government Feels Slow)
A surprisingly vivid example explained why public adoption feels glacial.
New York uses cargo e-bikes for last-mile delivery. They:
Operate in traffic lanes
Are not allowed in bike lanes
Do not behave like cars
For modeling purposes, the city counted one freight bike as 0.8 of a car.
That single decision forces:
New vehicle classifications
New edge-processing logic
New modeling assumptions
New regulatory justification
Multiply this by every emerging mode and the pace of change becomes more understandable.
7. Startups Are Trapped by Procurement Reality
A blunt moment came when panelists discussed business models.
“It’s incredibly hard to build an innovative startup when there are only one or two customers that buy at scale.”
Government procurement:
Takes a year or more
Offers little revenue predictability
Discourages experimentation
Without pipeline certainty, startups cannot build the tools cities need. Without validated tools, cities hesitate to procure.
It is a self-reinforcing stall.
8. What Comes Next: Low-Lift and High-Lift Paths
The panel ended with two paths forward.
Low-lift (near-term):
Determine how many validation points are needed citywide
Use existing cameras with software upgrades
Deploy neighborhood by neighborhood?
Build procurement plans around statistical confidence, not hardware counts
High-lift (systemic):
Move federal traffic analysis away from highway-centric models
Develop urban-appropriate frameworks for dense, multimodal cities
Rebuild confidence standards for “regulatory-grade” AI data
Final Thoughts
The panel made something clear.
The hardest problems in urban AI are institutional:
confidence standards
procurement timelines
privacy governance
education of civil servants
The technology to fix our streets exists. We have the sensors (cameras), the math (Spatial Interaction Pooling Transformation), and the models. What we lack is the procurement vehicle to buy it and the political confidence to deploy it. As we look toward 2026 and beyond, our job is to stop asking for trust and start providing the math and vision to make the urban benefits of innovation undeniable.